Objective
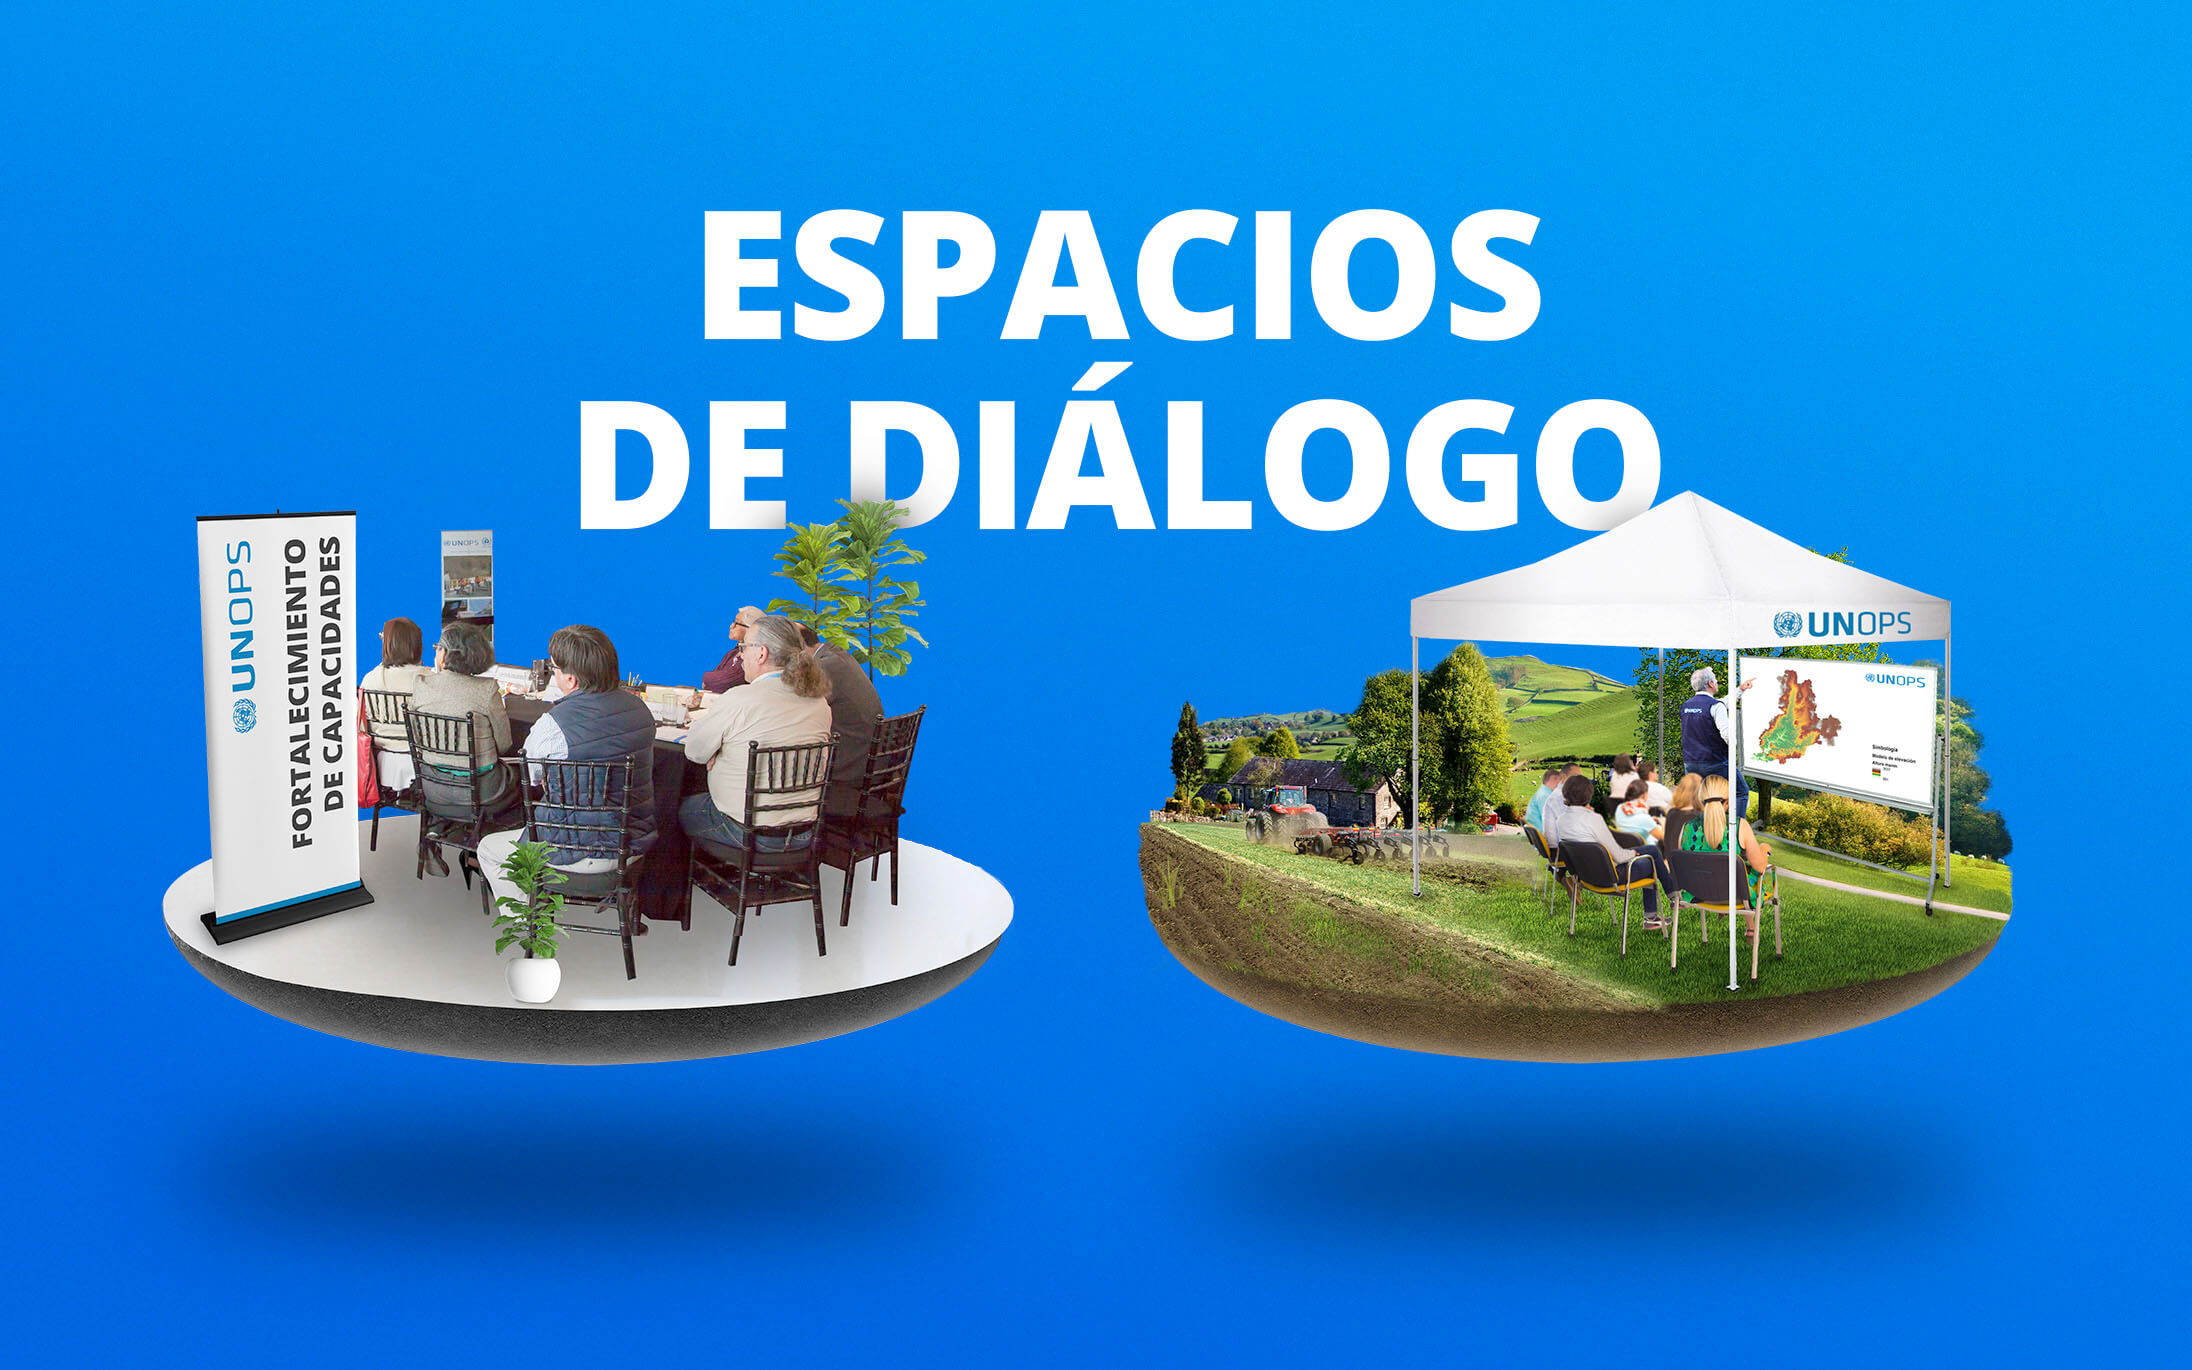
To transform complex hydrological research and technical findings into clear, accessible communication materials for remarkably diverse audiences, from residents of communities facing potential flooding and displacement to business leaders, government officials, and policymakers. The challenge was to make specialized information understandable without compromising its accuracy, sensitivity, or neutrality.
Solution
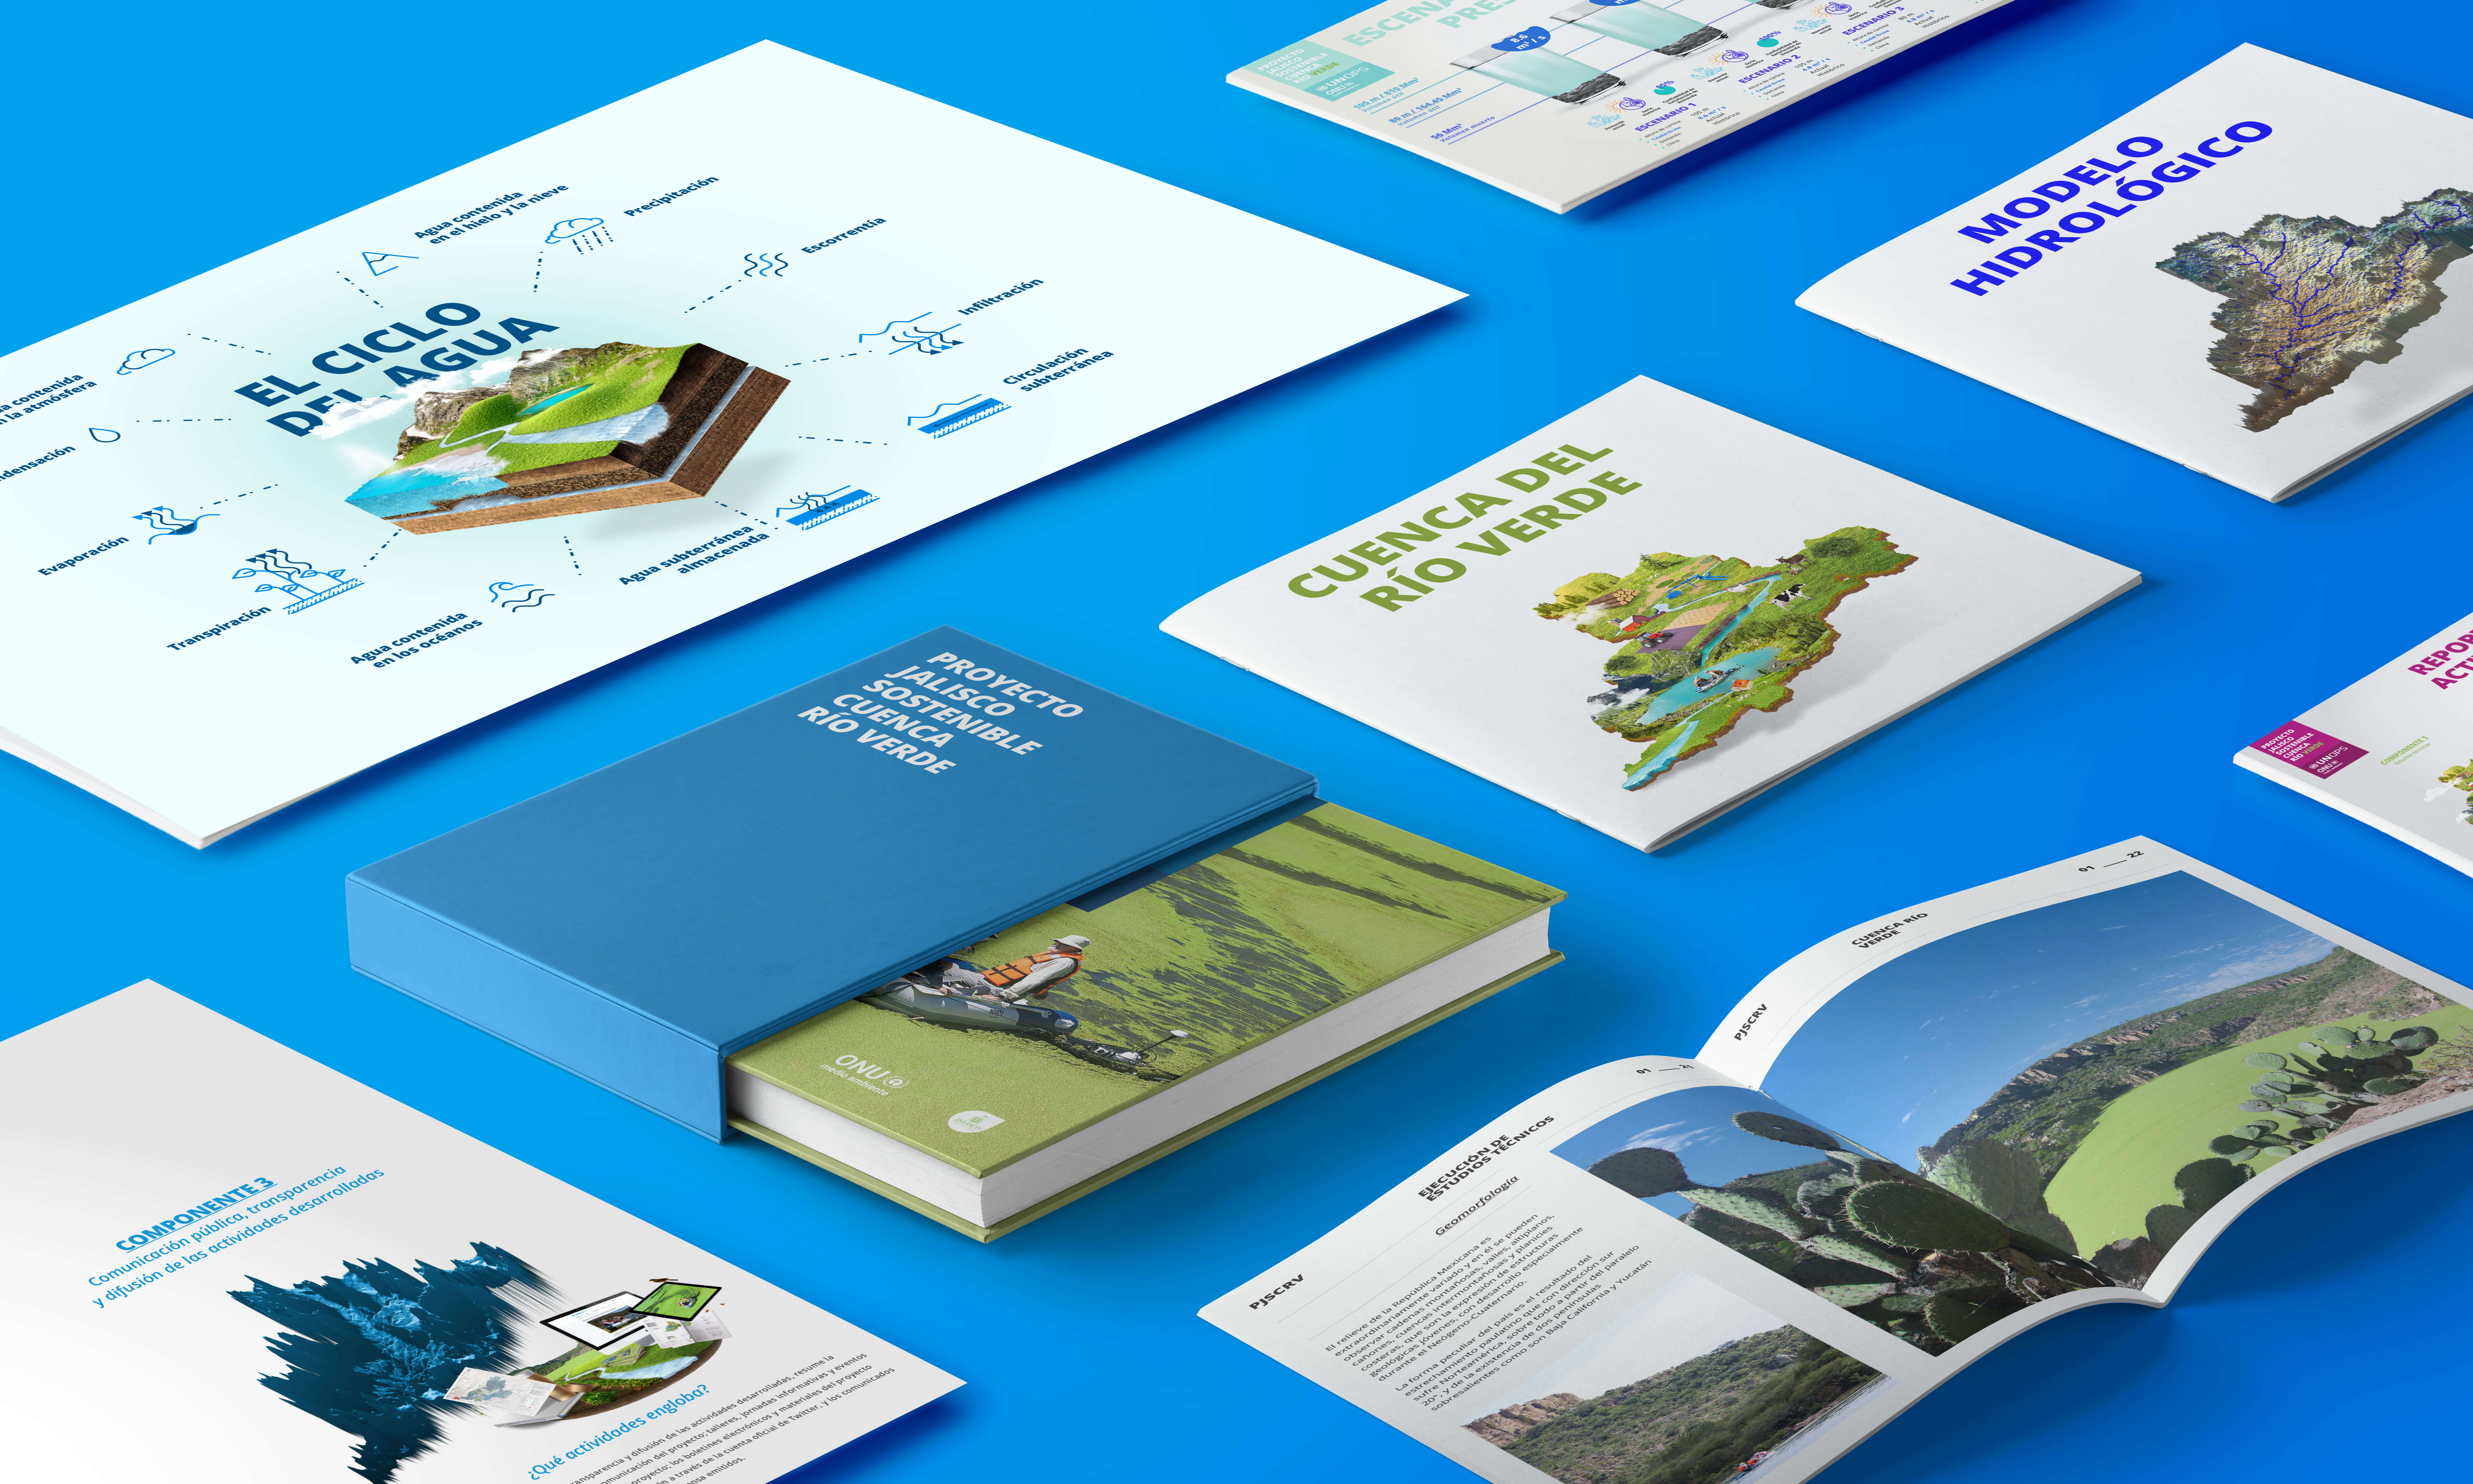
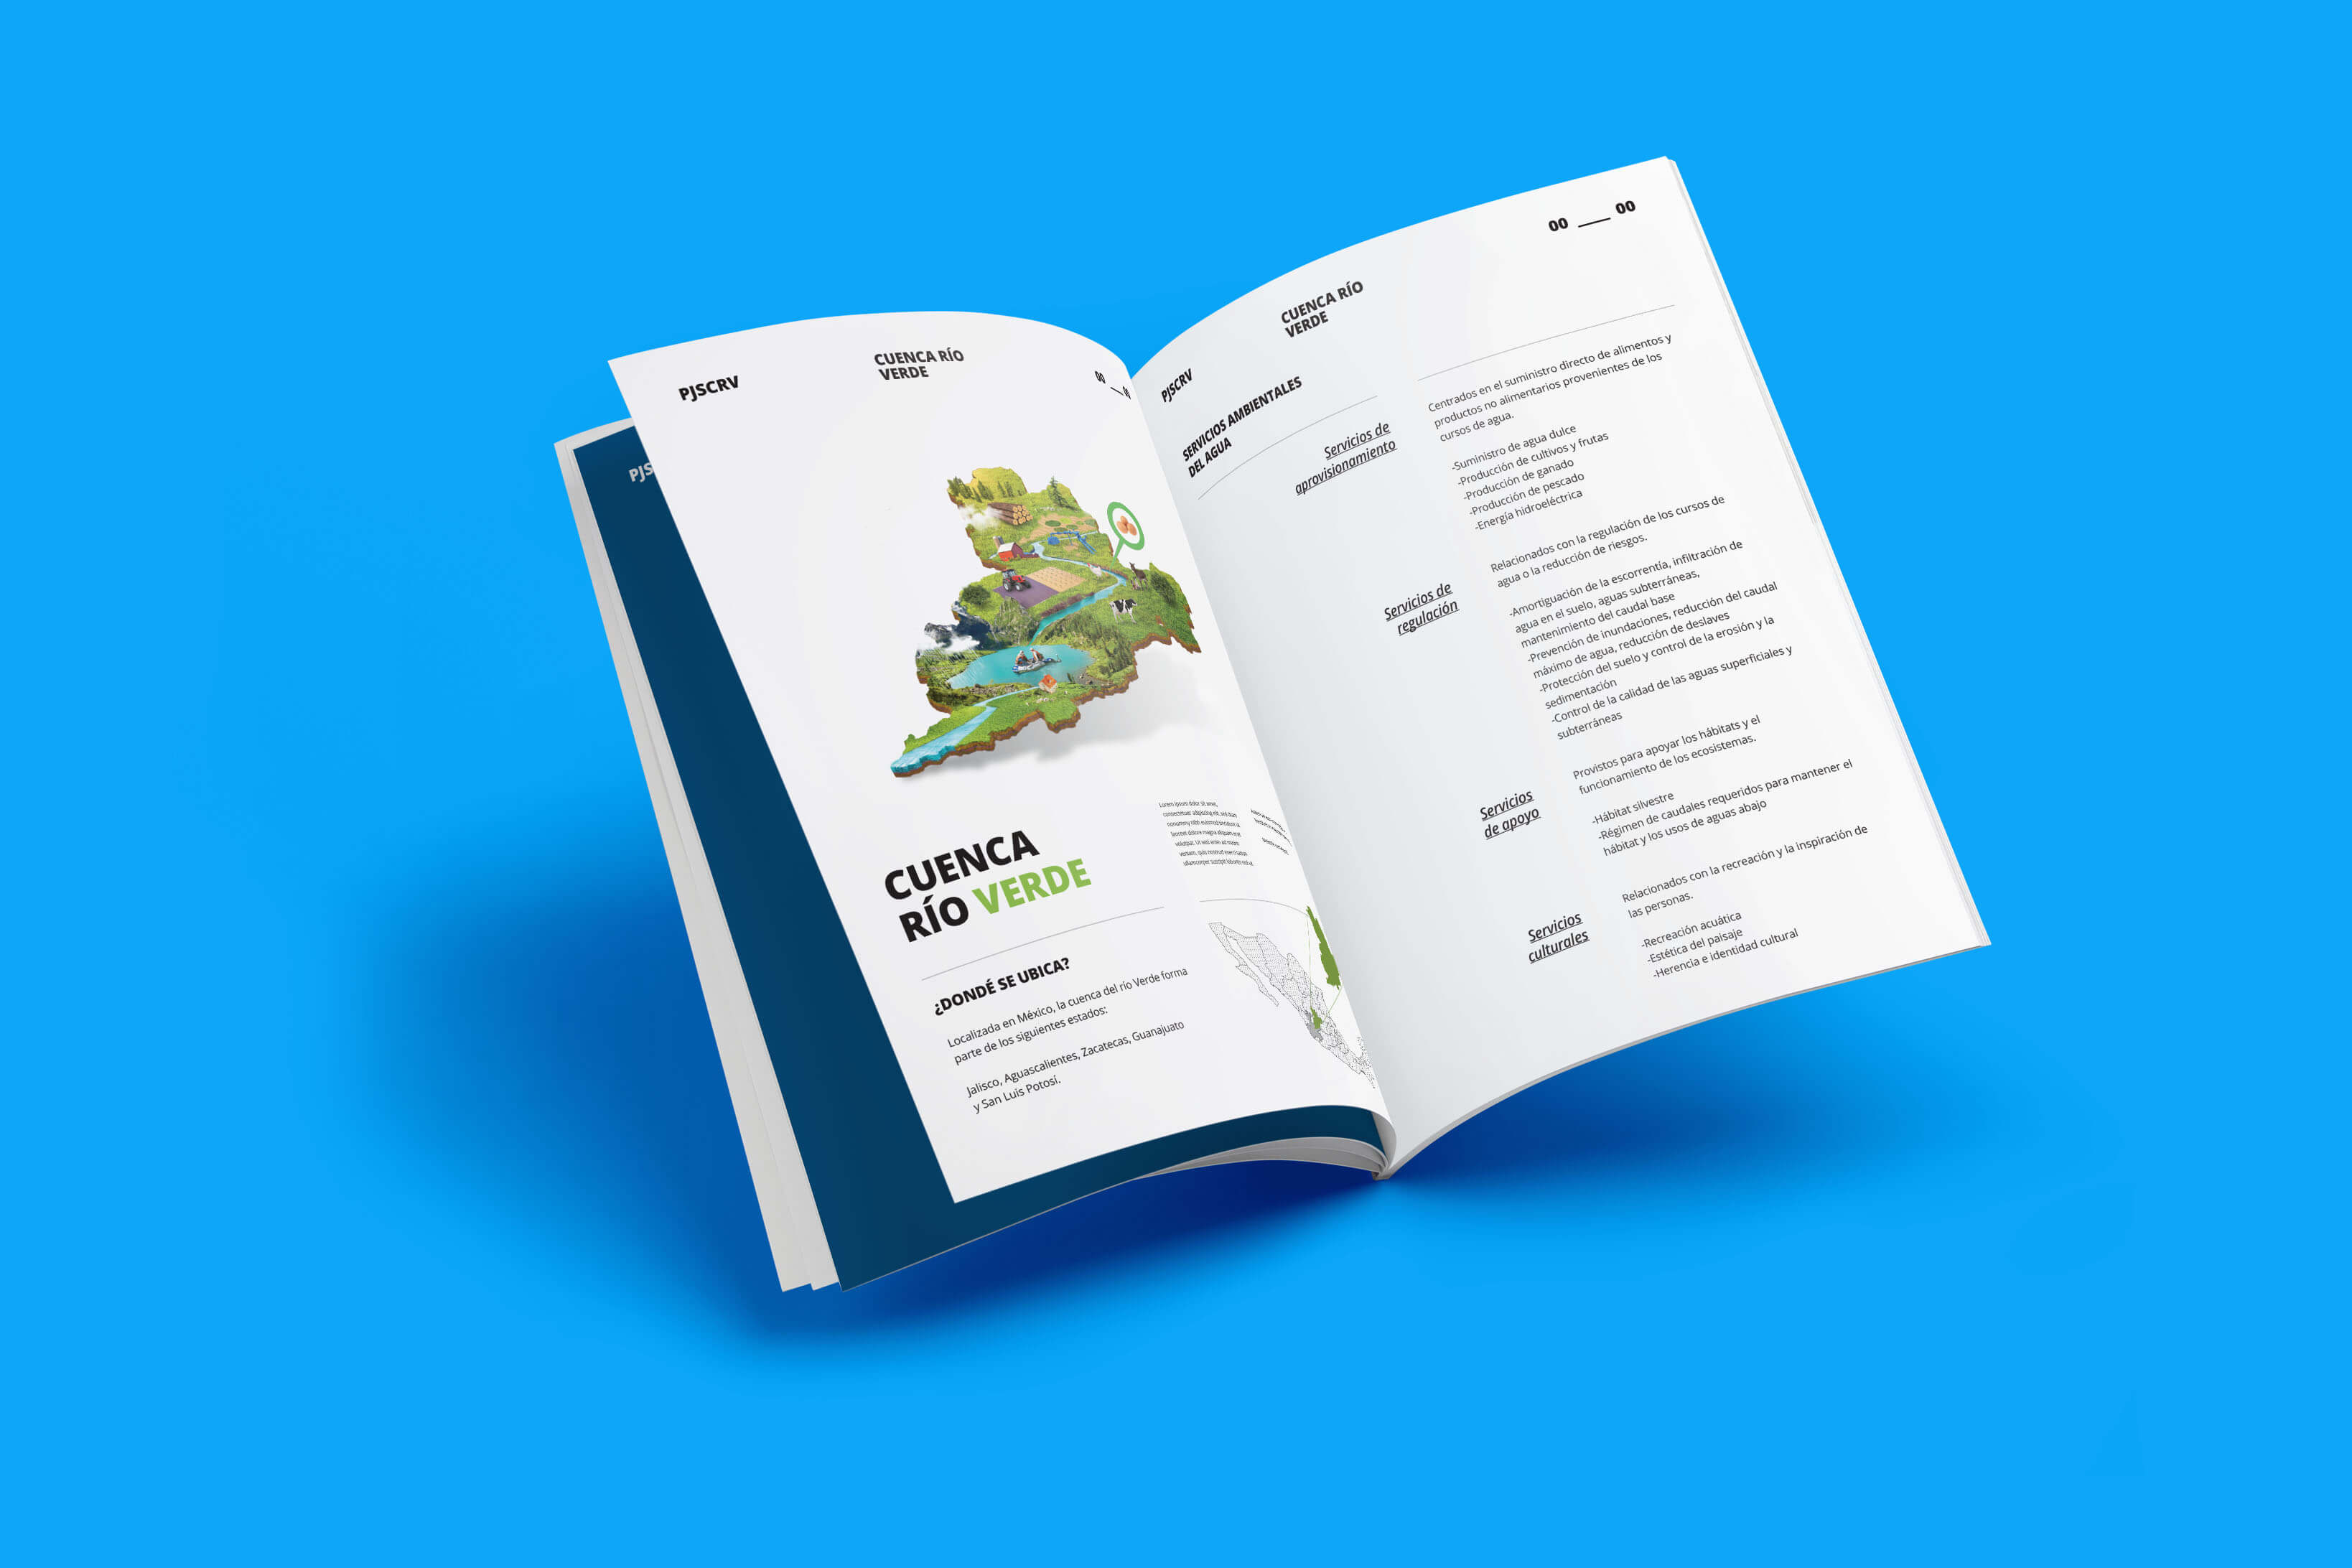
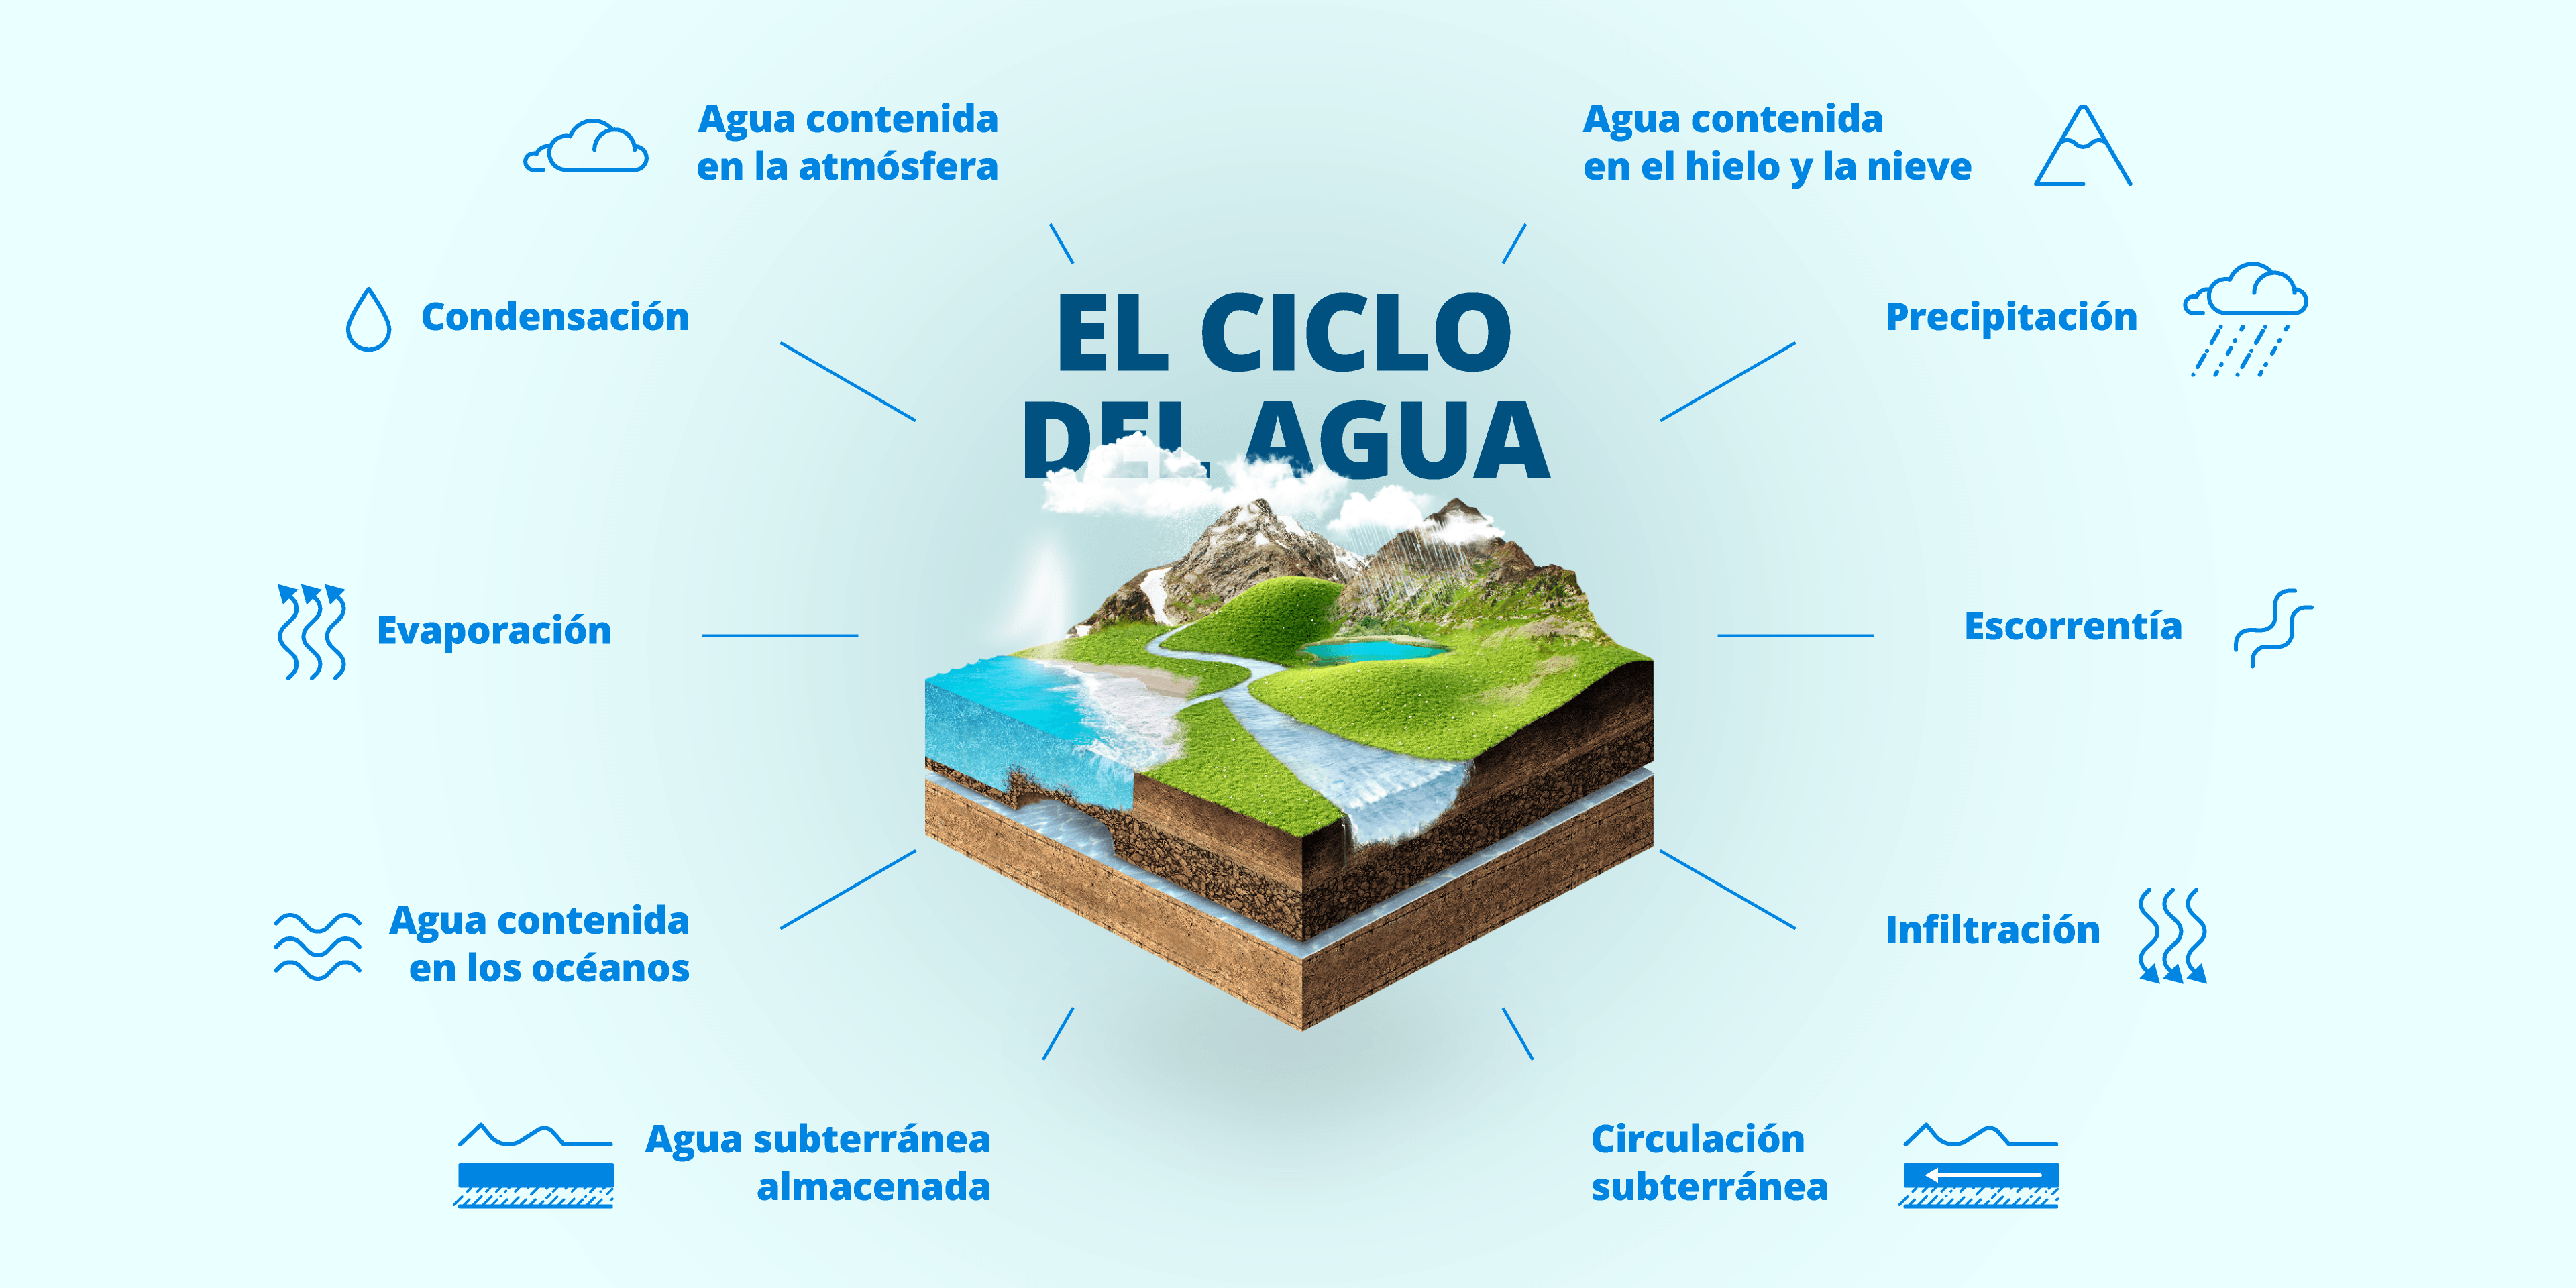
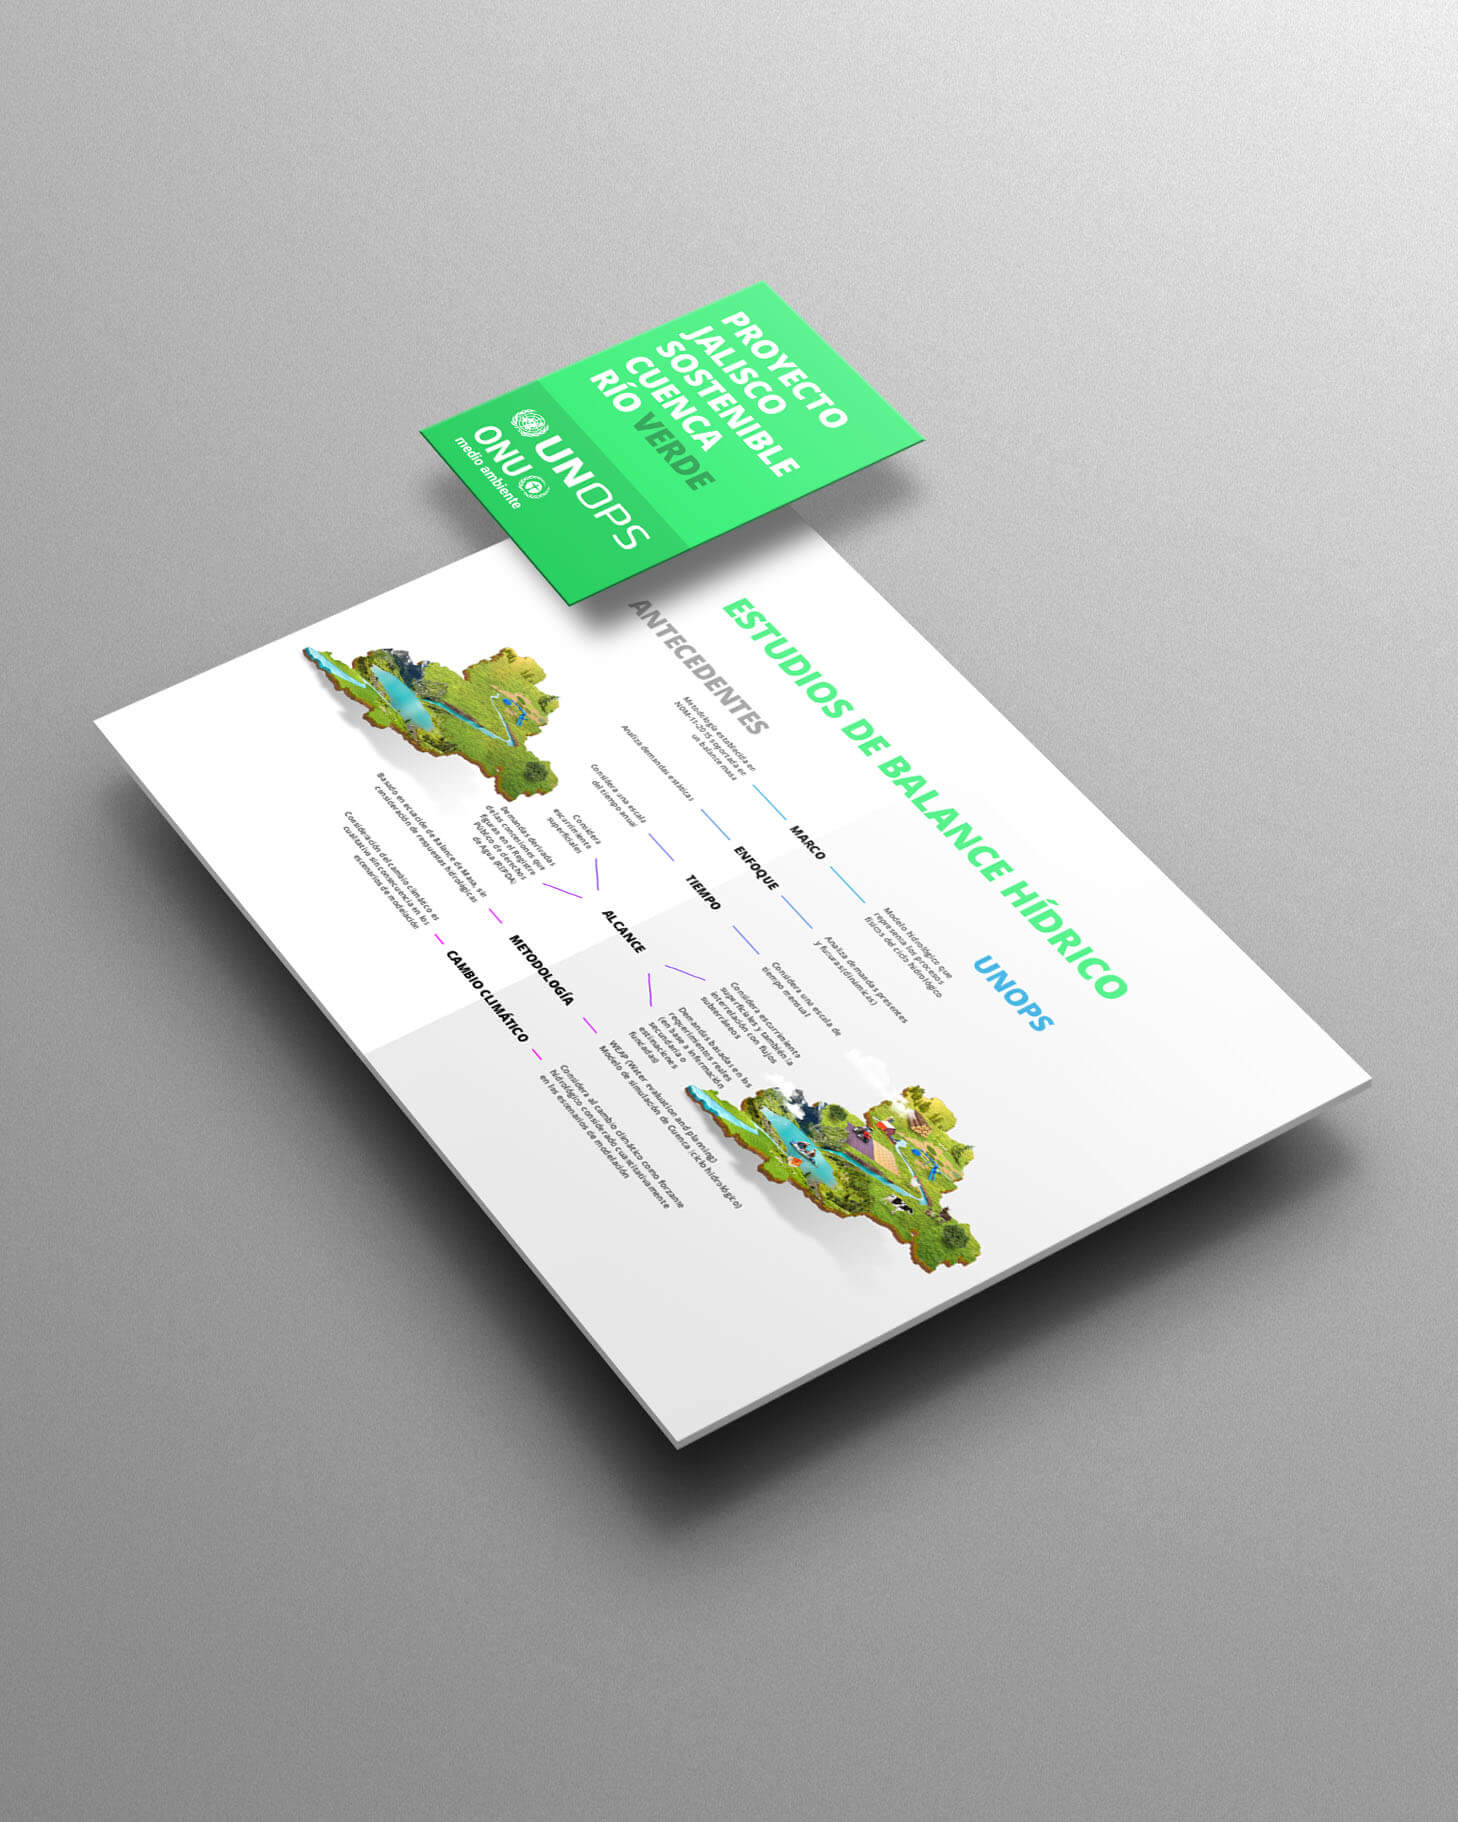
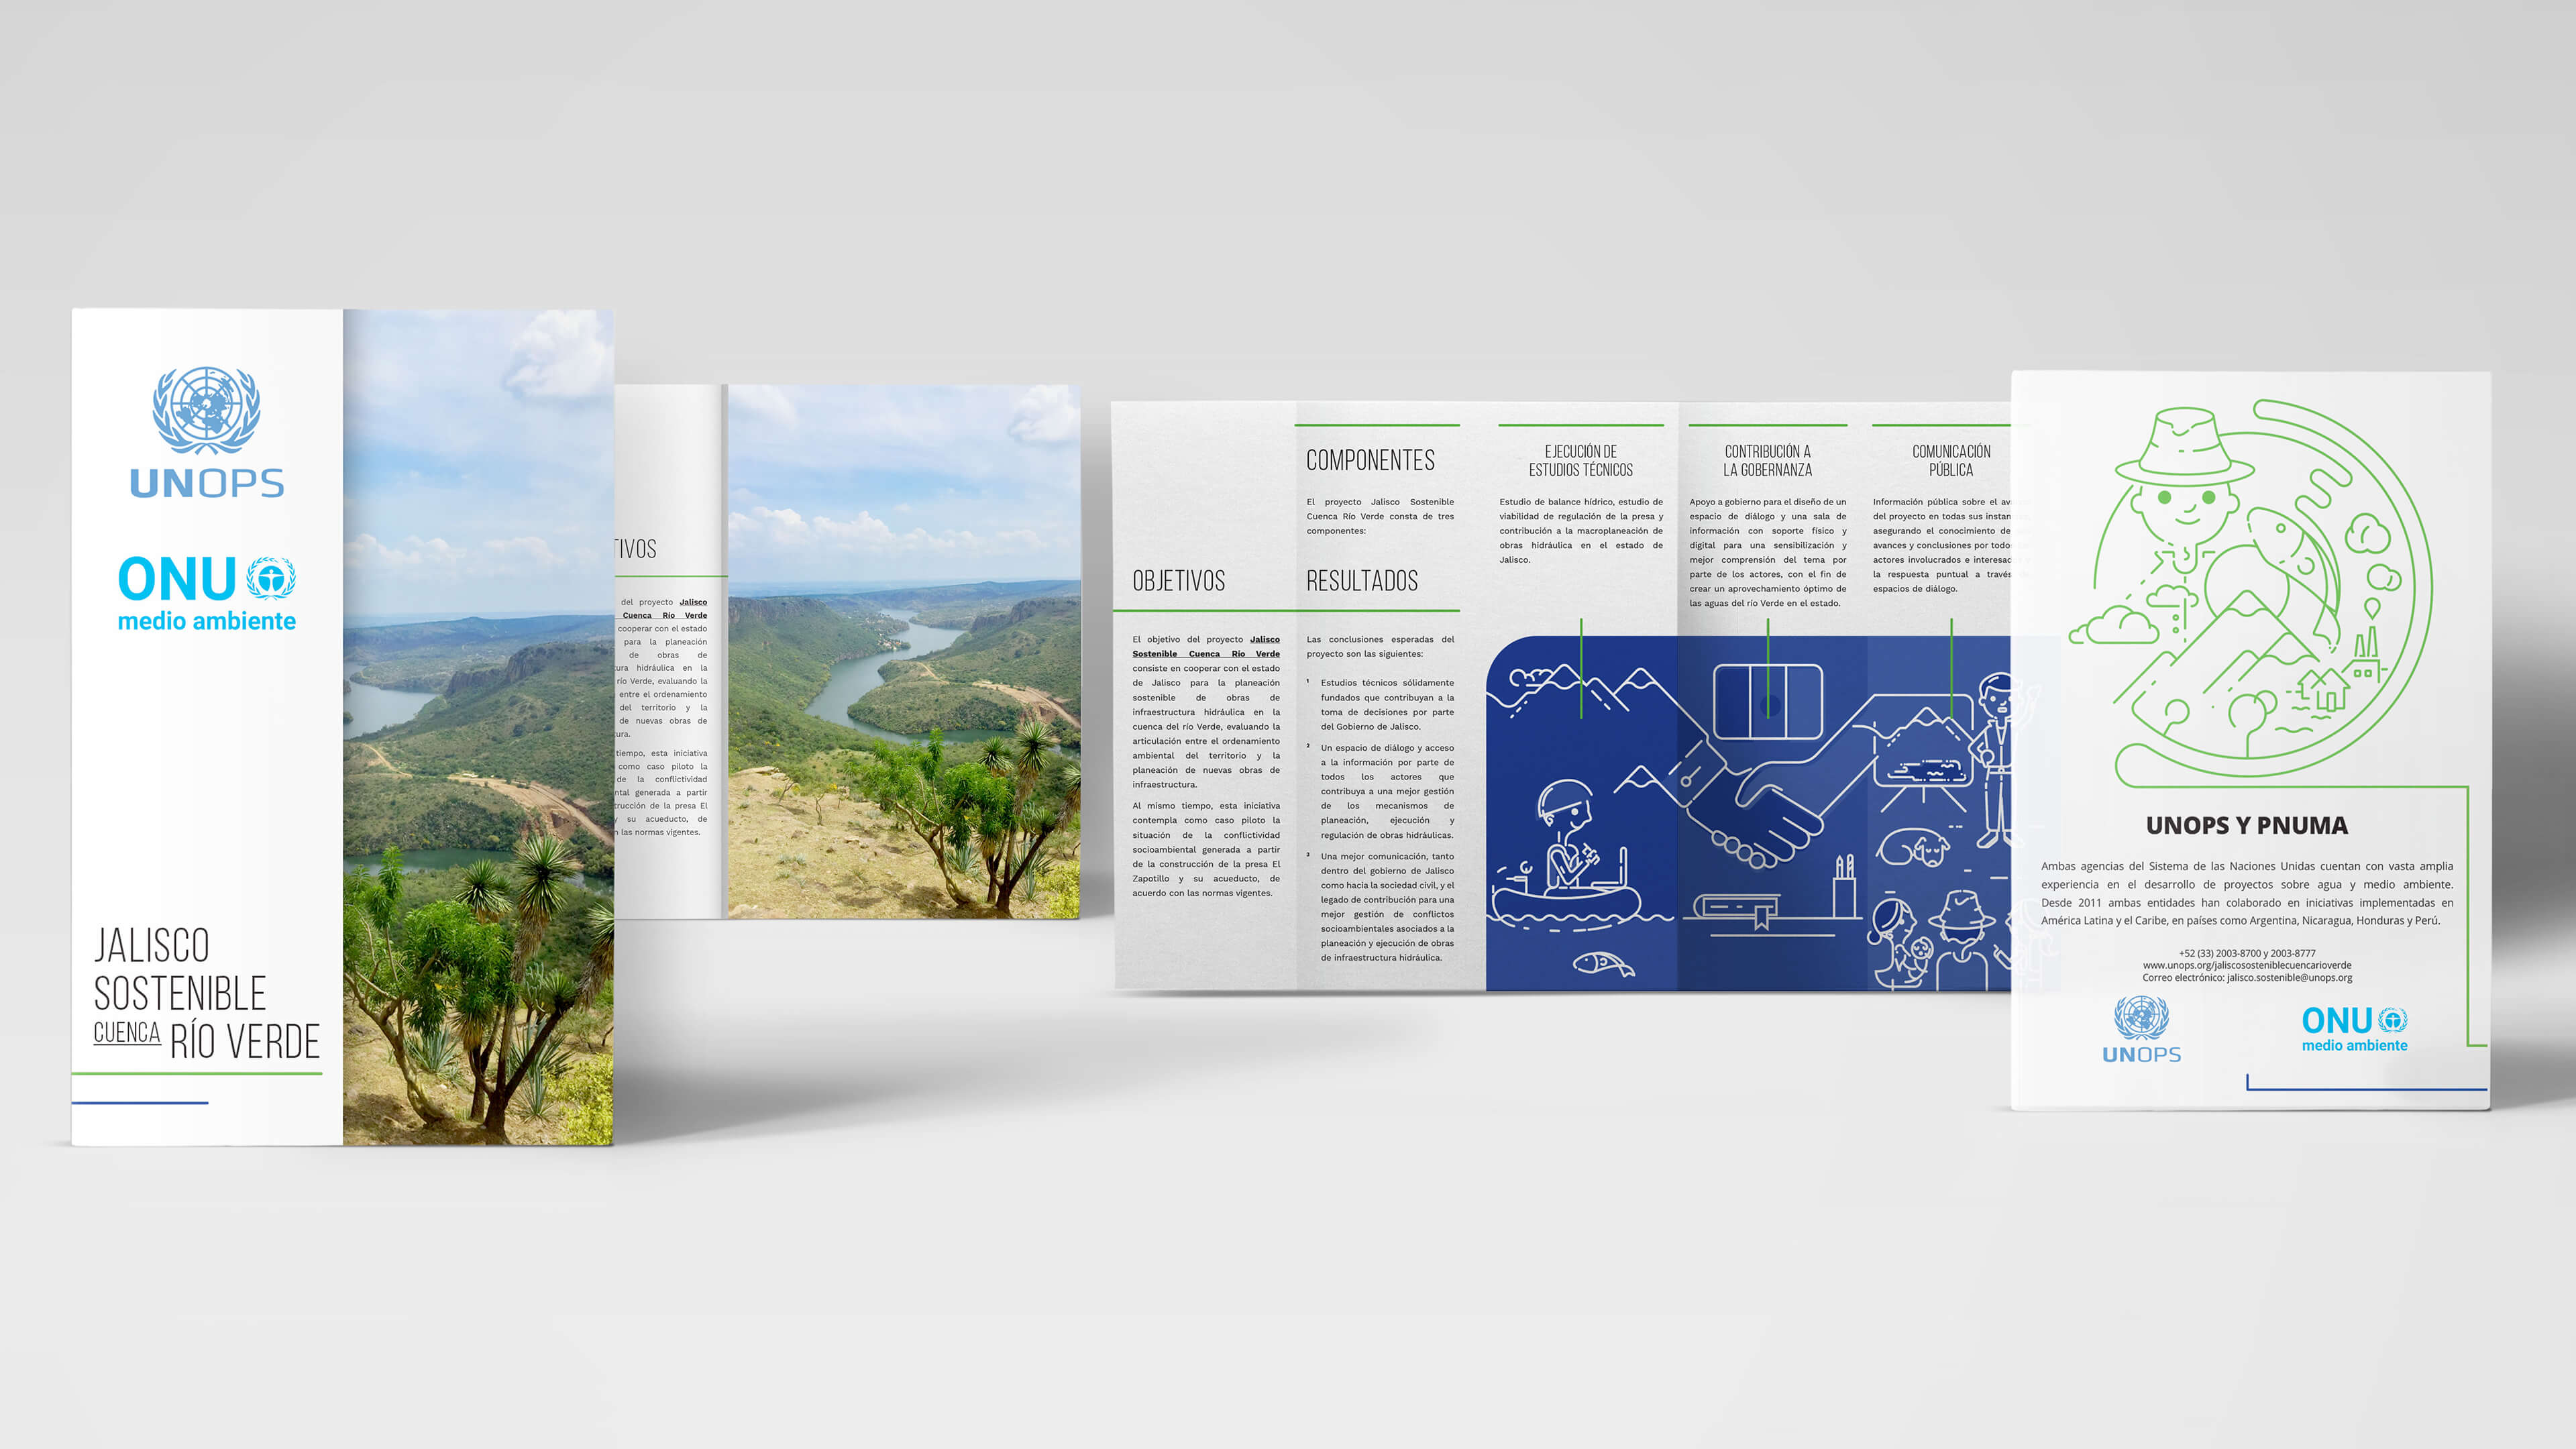
We developed an editorial and infographic system designed to simplify the presentation of technical information through clear visual hierarchies, highly legible typography, and an accessible graphic language. A consistent iconographic system helped communicate complex data and concepts across different formats.
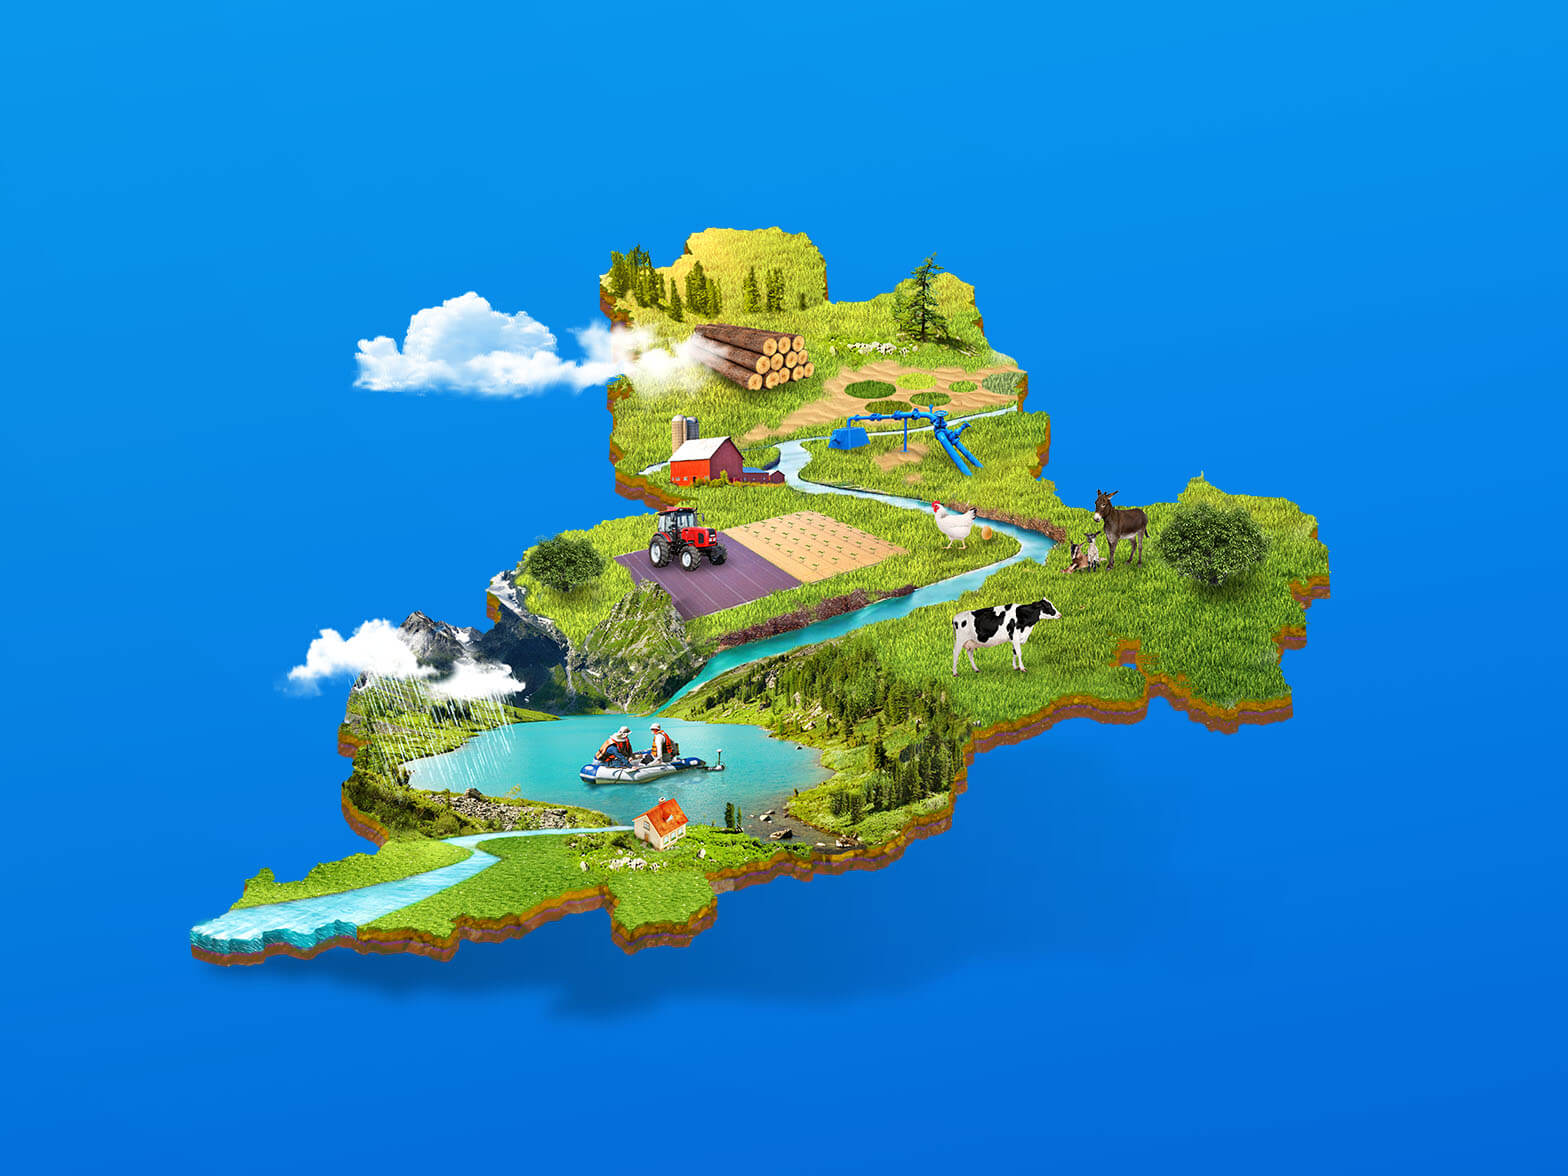
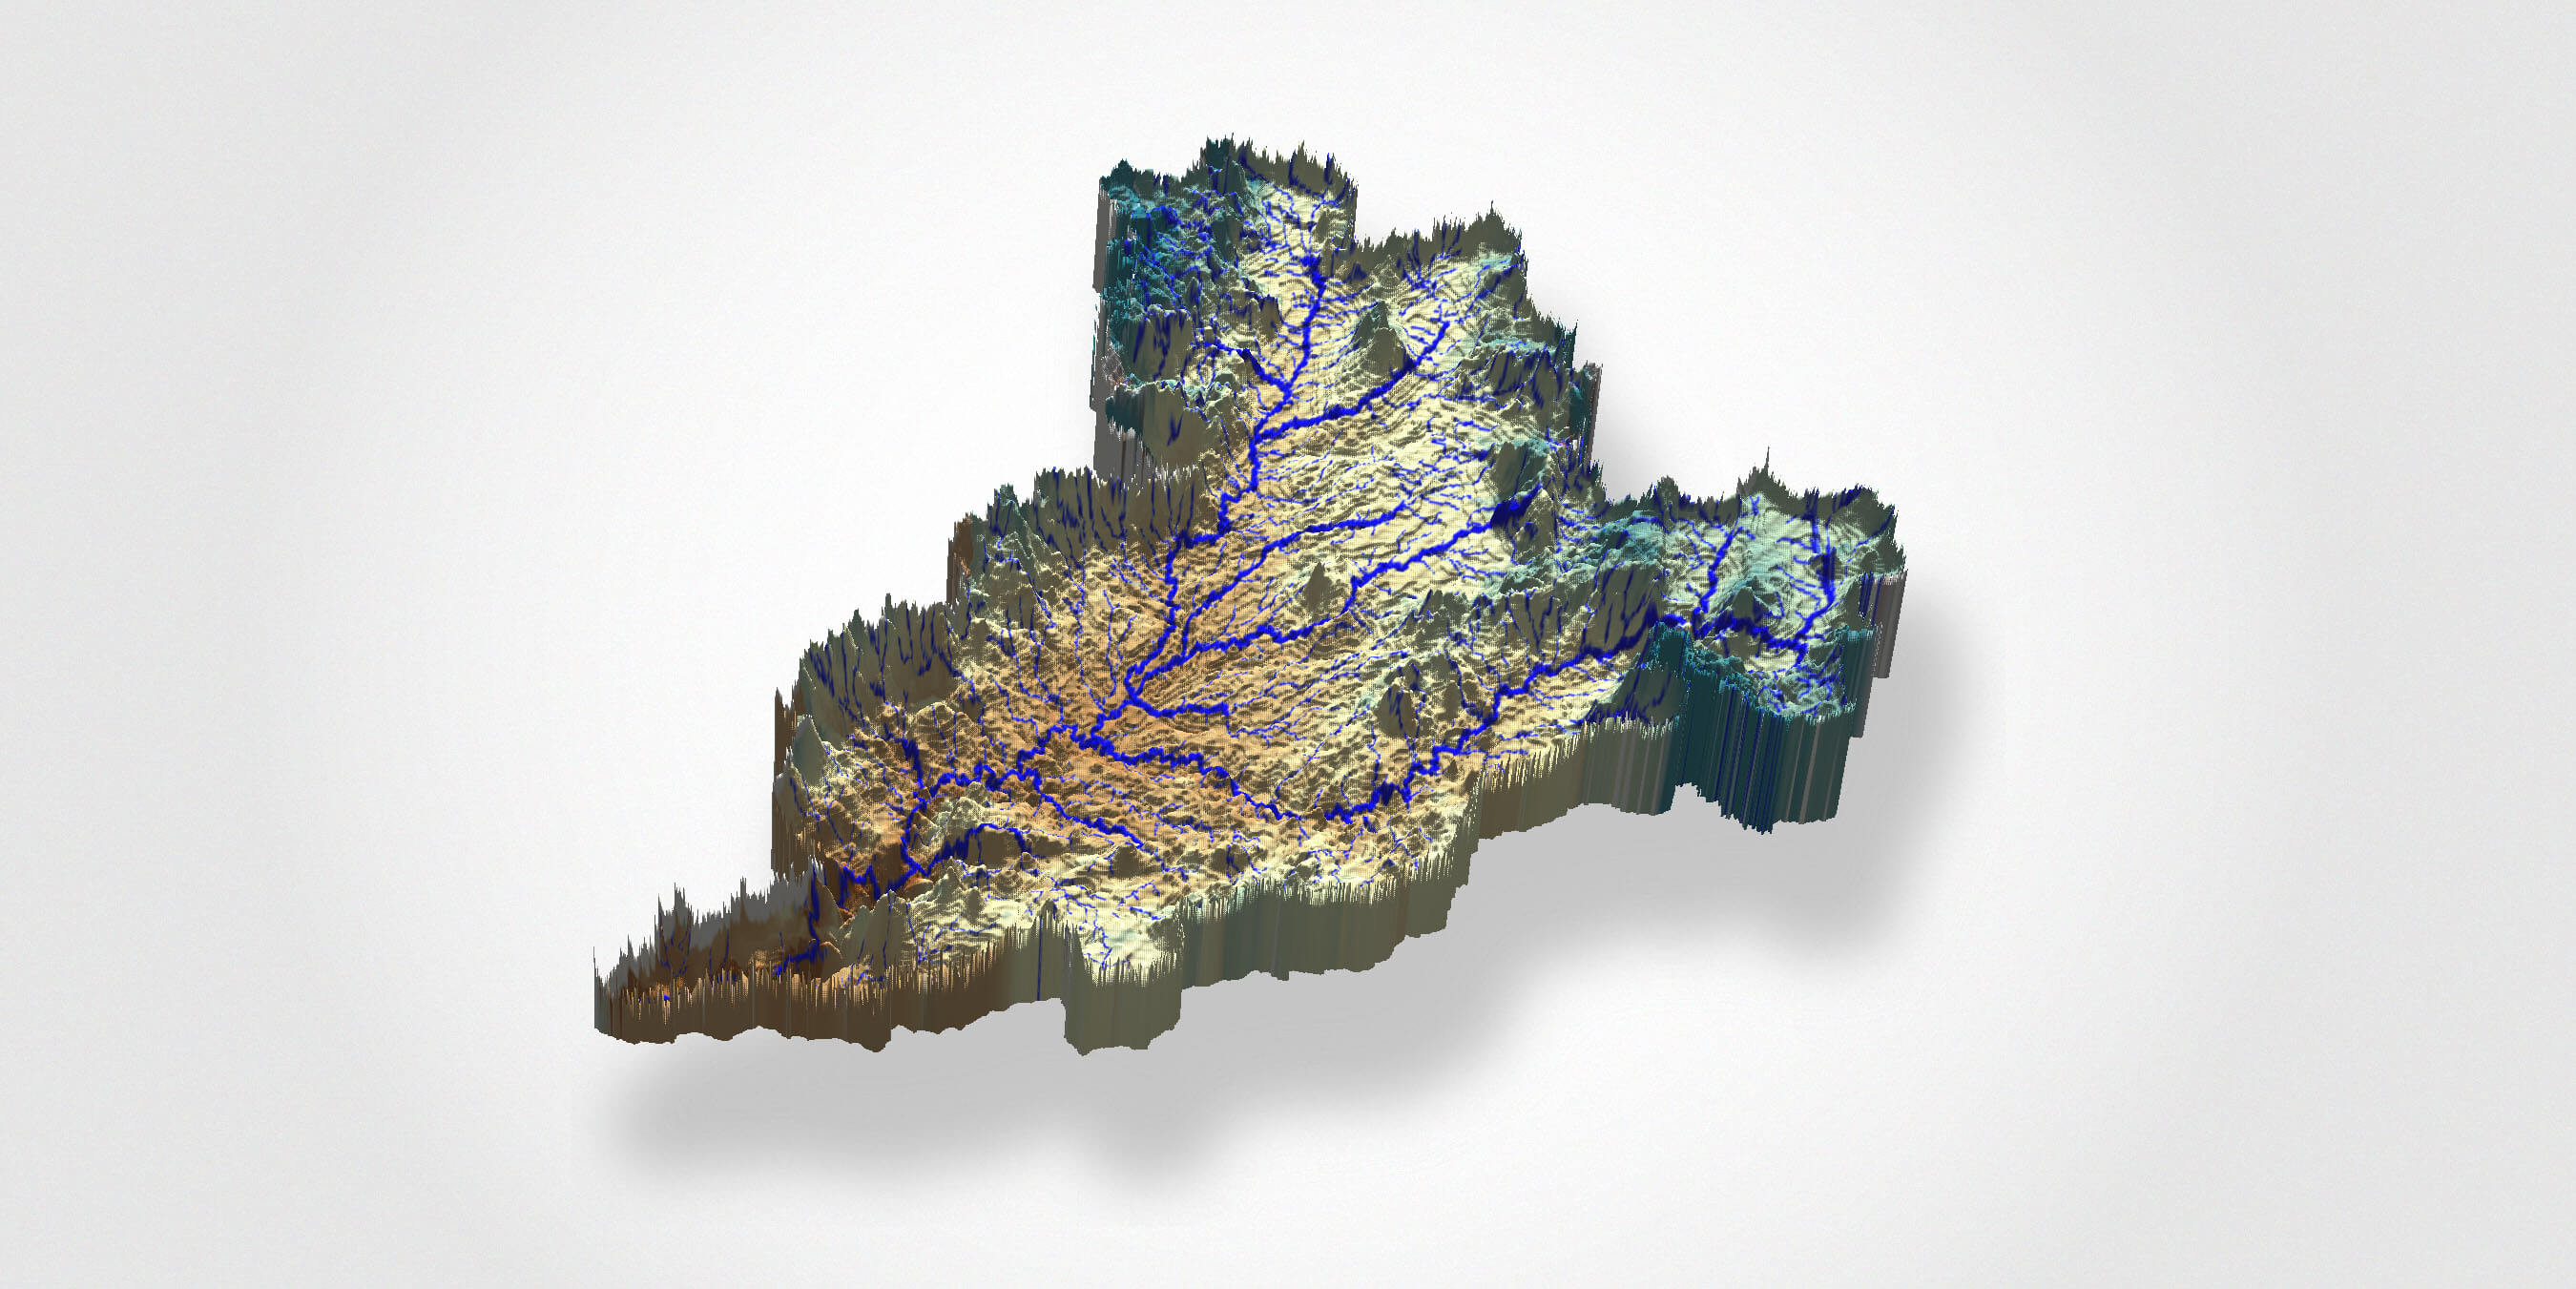
We created detailed digital illustrations and three-dimensional visualizations to explain the Río Verde basin, the water cycle, hydrological models, and infrastructure scenarios. These illustrations transformed abstract technical concepts into tangible visual representations, making the information easier to interpret for audiences with different levels of technical knowledge.
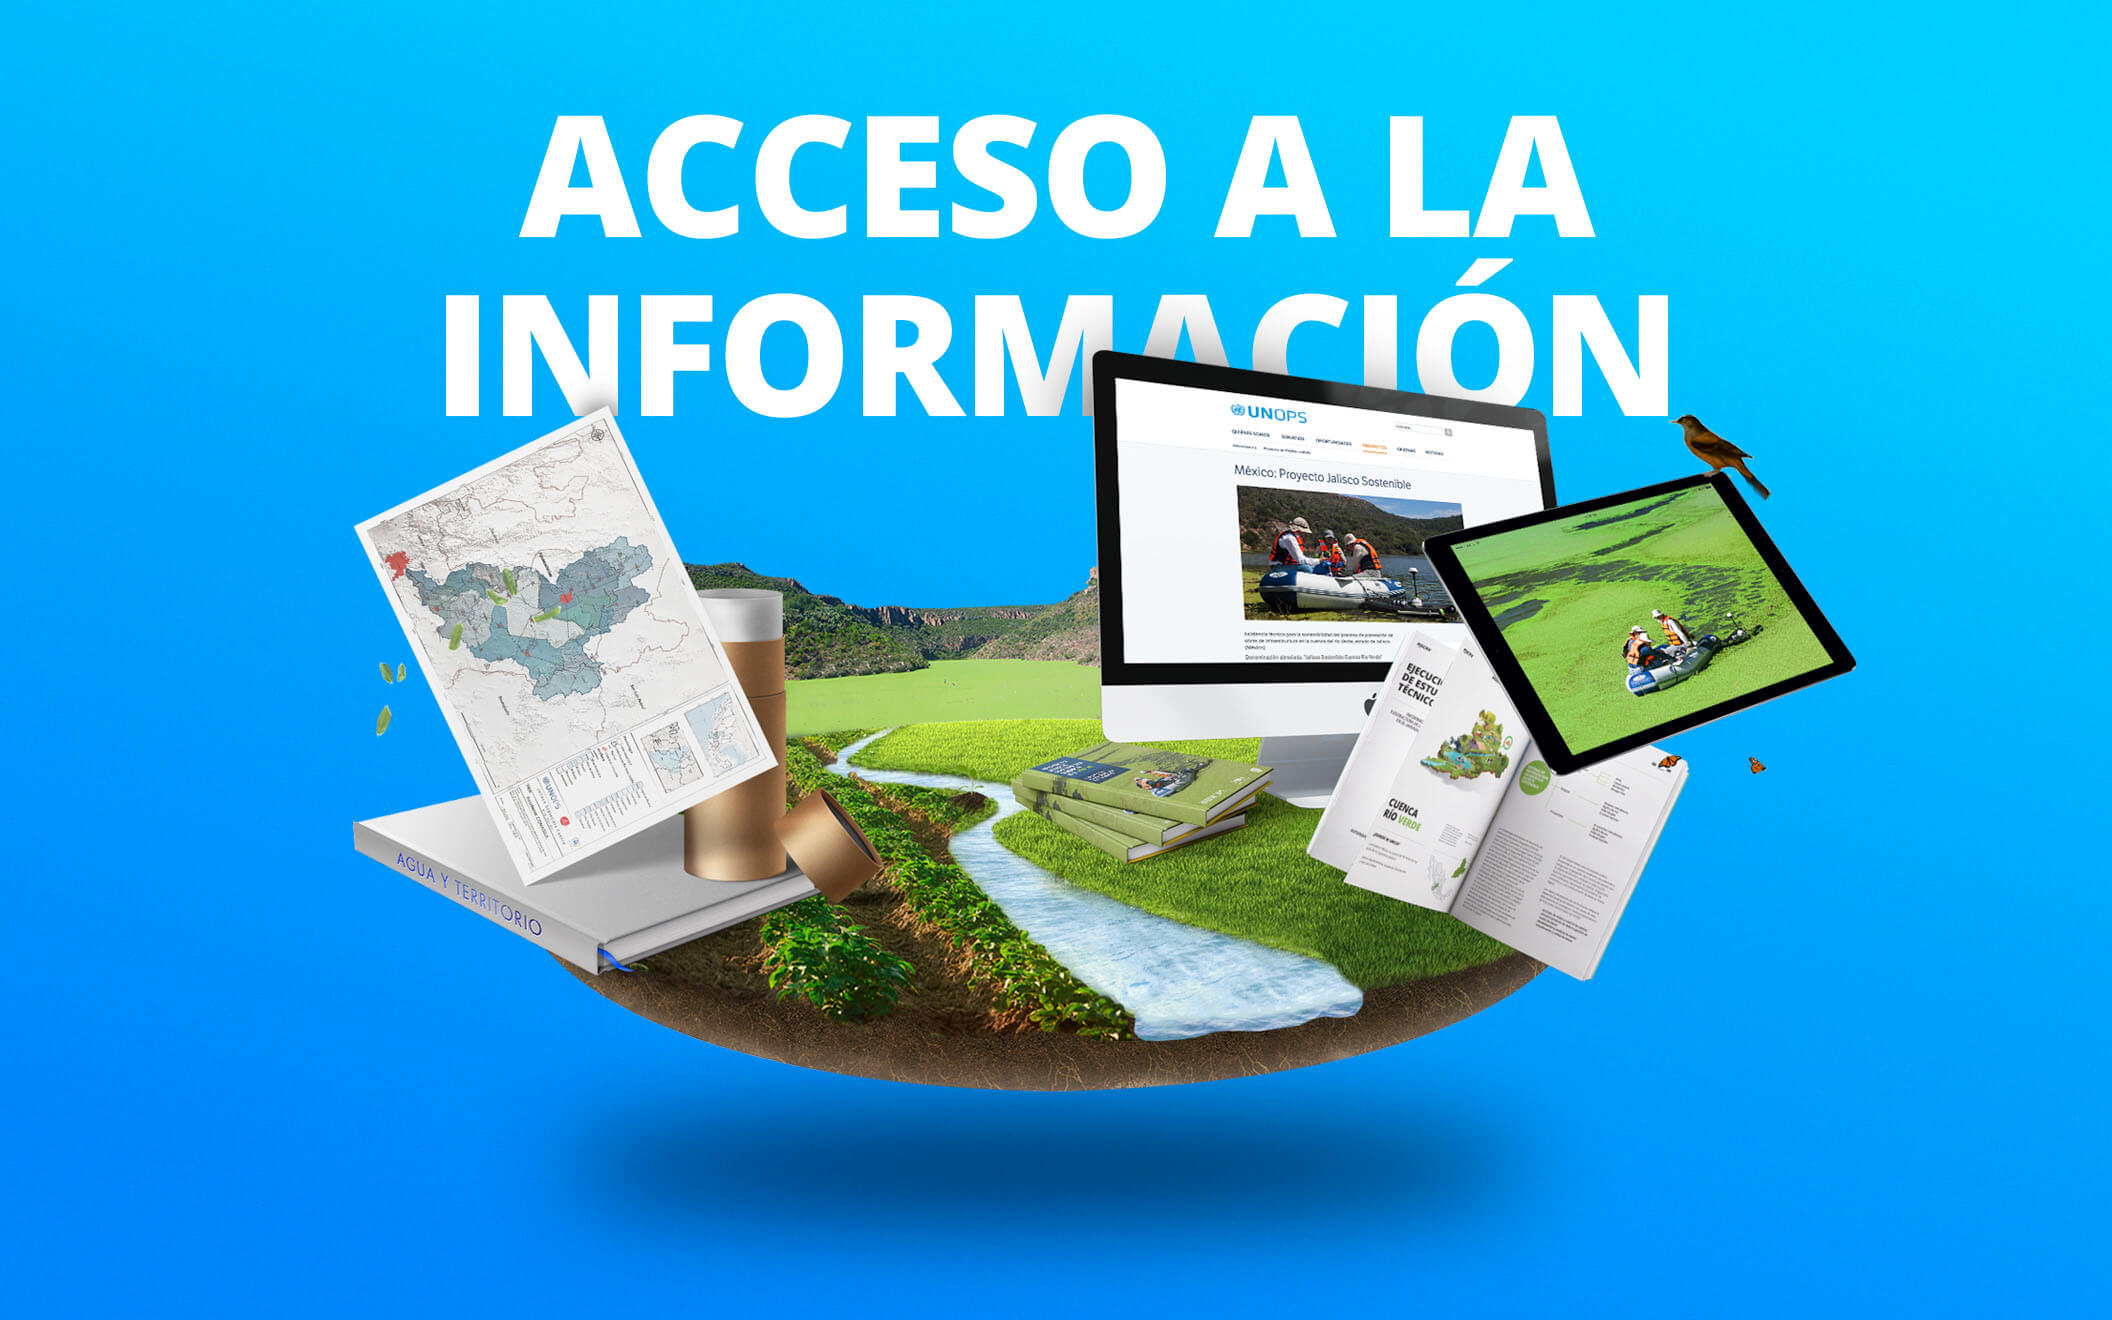
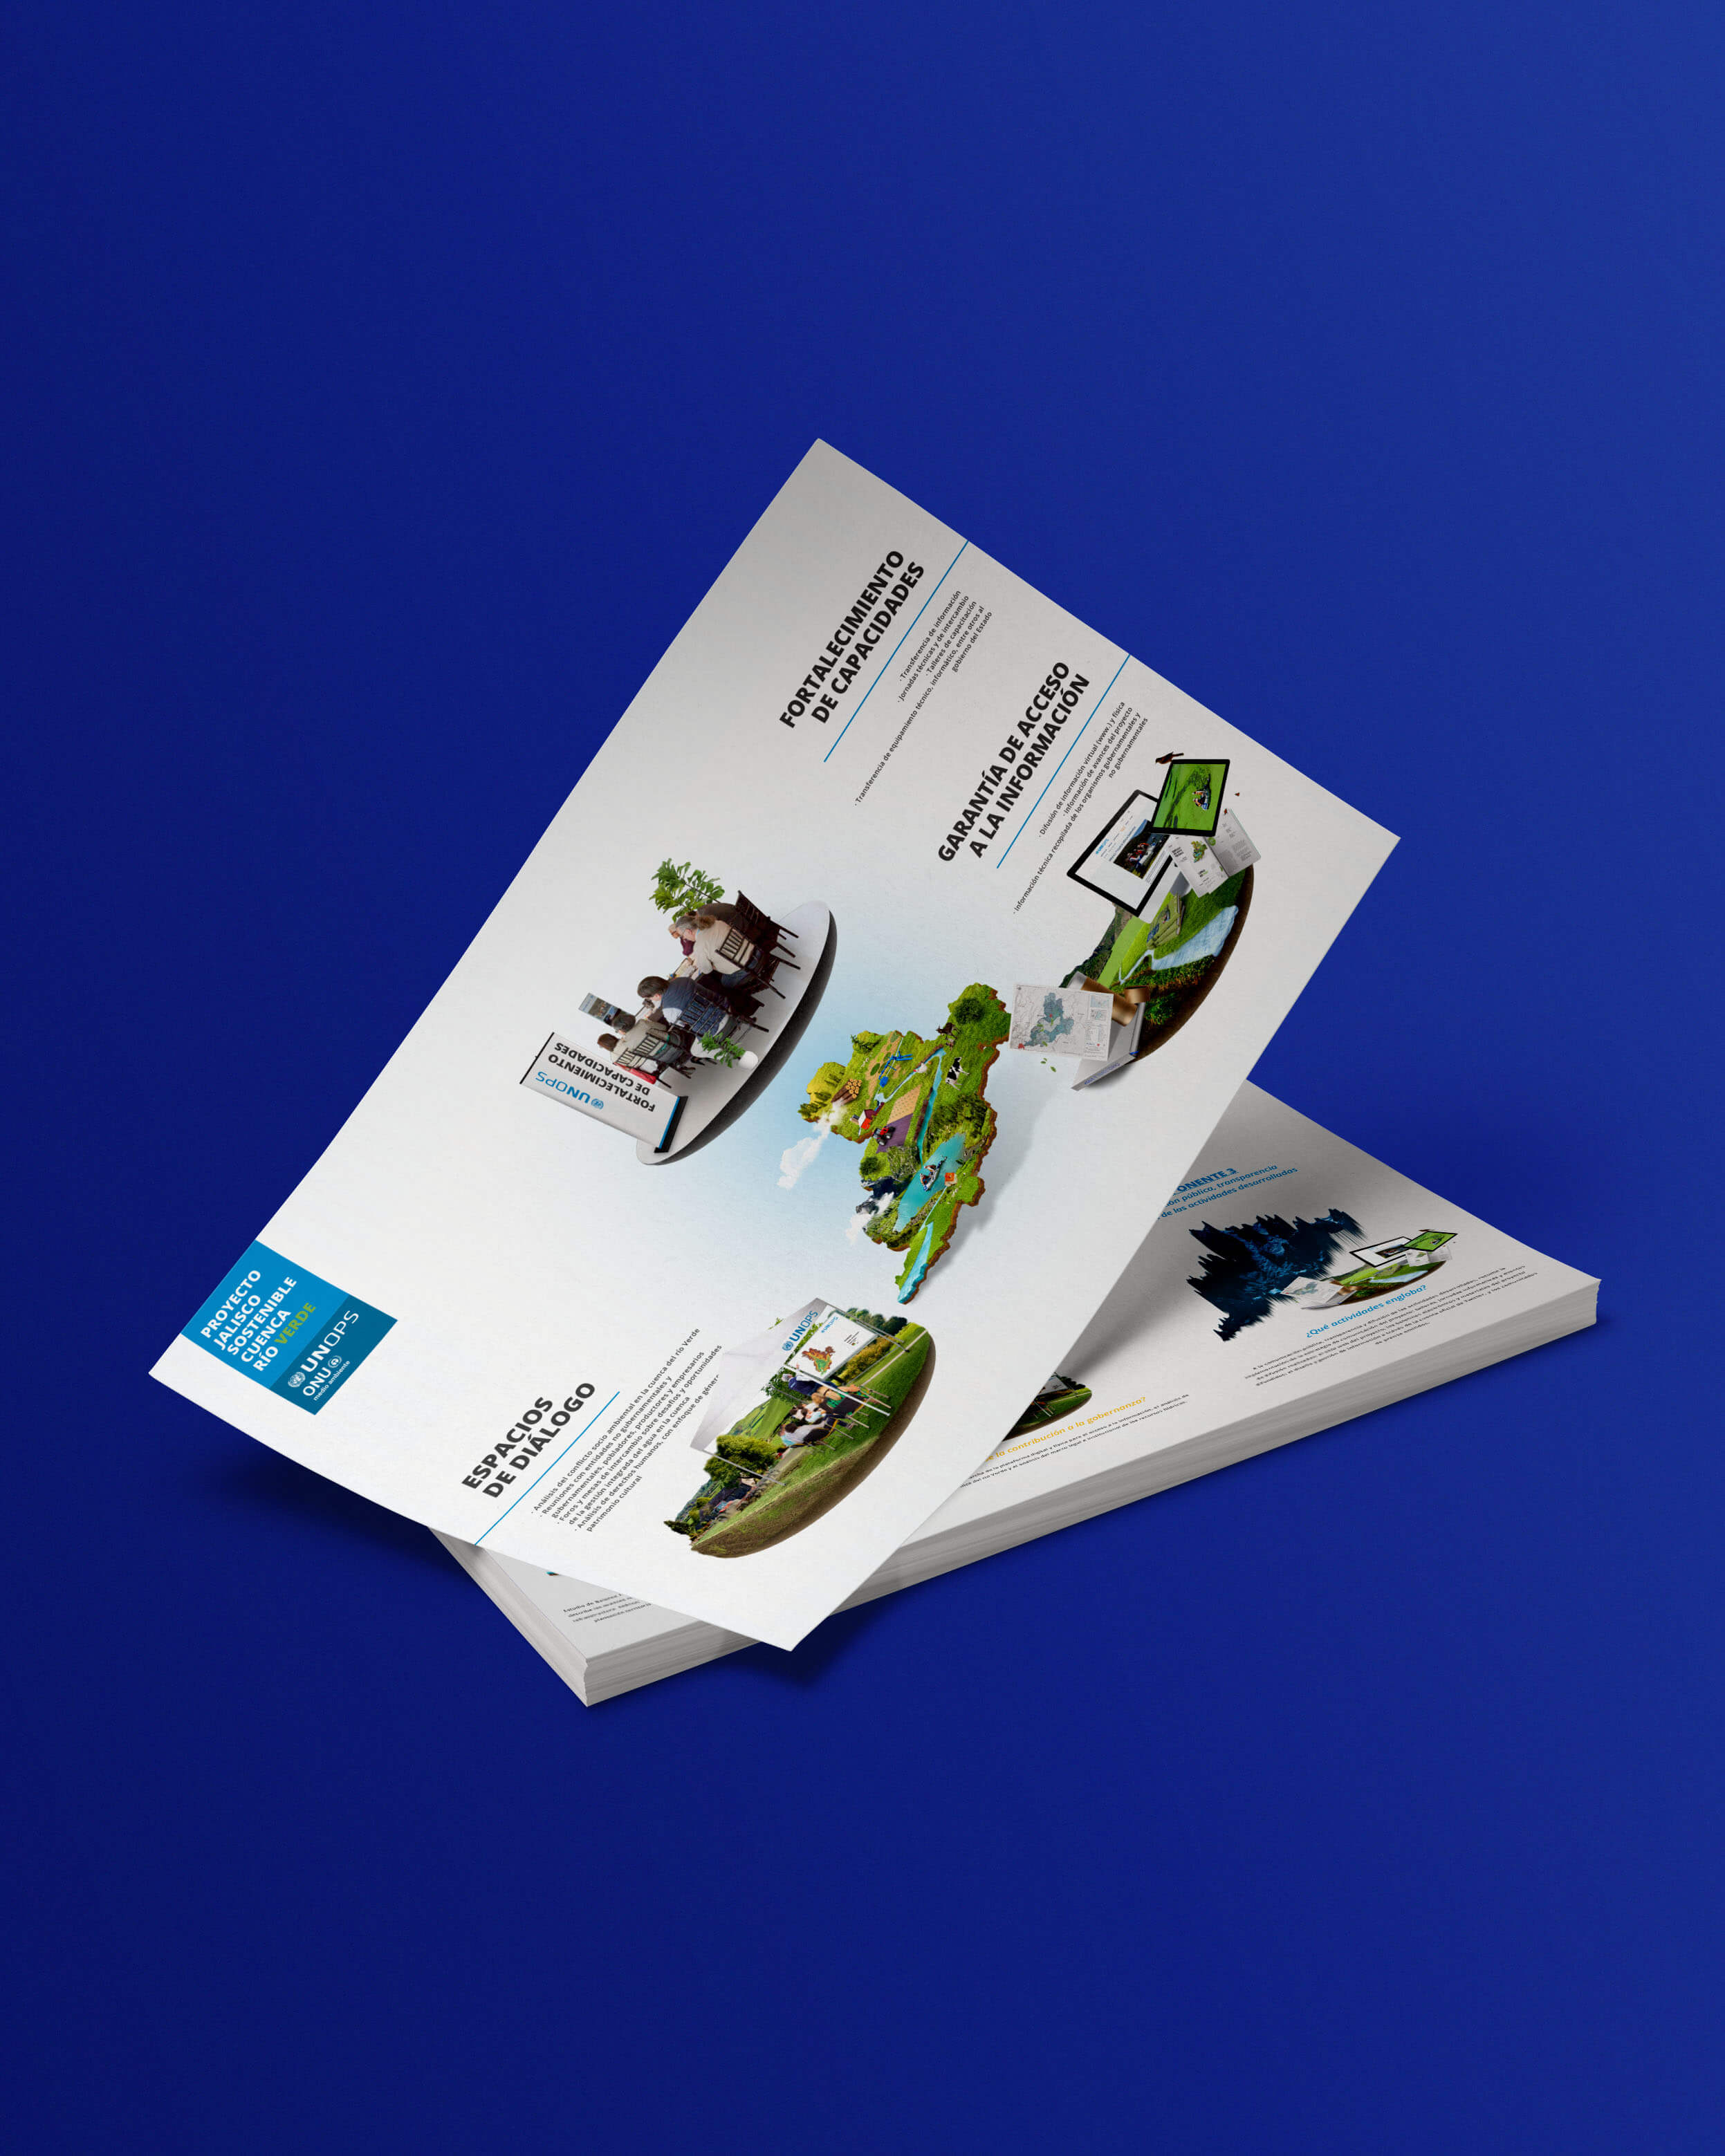
The system was extended to reports, brochures, infographics, and other educational and communication materials. Together, these applications provided UNOPS with a cohesive visual language to communicate complex findings and support public understanding and informed dialogue around a socially sensitive infrastructure project.